

CRMScript - Tracing of scripts
When debugging in real time, or when viewing a saved script trace, we have a dropdown to the UI with all the source locations for the current debug/trace session. For large scripts that are using#includes, this allows you to quickly switch between the different sources.
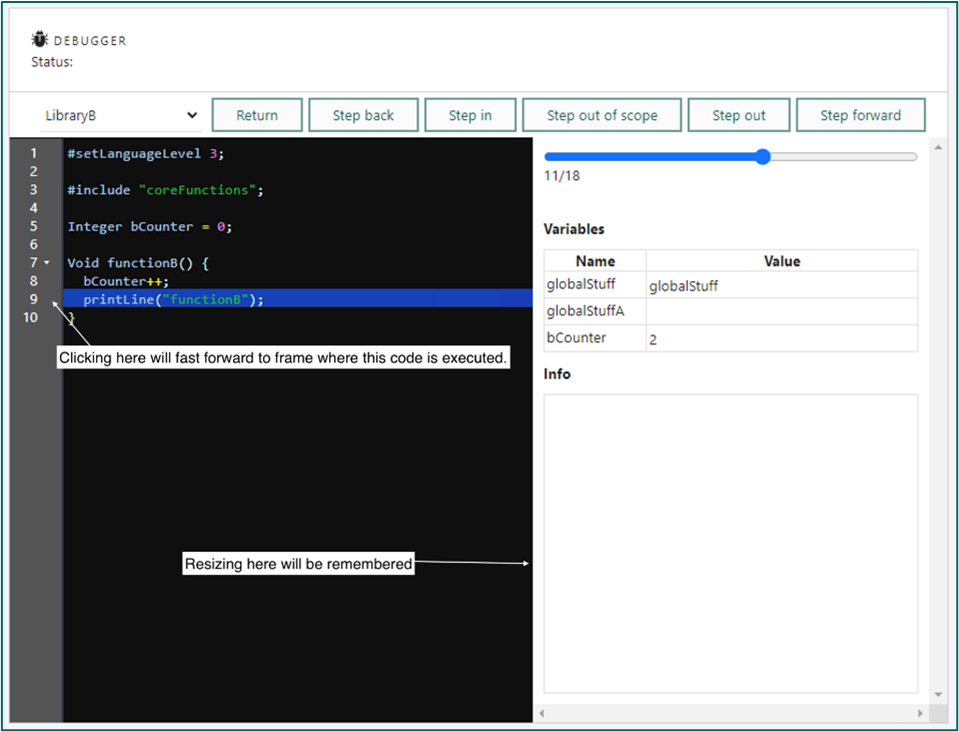
- In debug mode, you can use this to e.g. set a breakpoint in another file.
- In tracing mode, clicking in the gutter (where the red breakpoints are shown) will now instead fast-forward the trace to that location. This can be very useful when viewing large script traces: instead of having to use the slider to try to find the frame where some particular code is executed, you can rather click next to the code and the slider will move to the correct position.
- CRMScript developer improvement (blog on Community)
- Bug 28896
- Bug 28140
- Bug 28482