

So, in this example, let’s say we would like to create a report listing number of requests, average closing time for each user in the system for requests created the previous month. Furthermore, we would like this grouped by an extra field we have created on request which tells us if this is a hardware or software issue. Unfortunately, this field only contains various texts, so we need to do some transformations. If the value of this field contains “Cisco” or “Linksys”, it is considered hardware, otherwise it is software. This is to exemplify how to transform data before grouping and aggregating.
First, let’s create a
SearchEngine, which will fetch our data. The DateTime class has some nice functionality to get previous month. You can find details about the ticket fields in the database reference.
StringMatrix which allows us to transform the second column to “hardware” or “software” so that we can group on it. Note that if you do not need to do any transformations of the data, you could bypass this step by calling StatLib.setSearchEngine() instead. The StringMatrix is simply a matrix of all the data in the query result, and allows you to modify cells, delete or add rows. In our example, we will iterate all rows and check the value of ticket.x_equipment and convert it to “hardware” or “software” depending on what we think it is. Another typical usage of transformations is to change dates to Q1-Q4 for instance, so that you afterwards can group on quarter.
StatLib instance.
StatLib, we can specify our groups.
Due to a limitation of this object, grouping can only be done on column 0..n in ascending order. You first have to group on column 0, then on column 1, and so on. Make sure your query starts with the columns you would like to group on.
- count
- sum
- avg
- max
- min
- countNotEmpty
StatLib, and we can execute it. To simplify the traversing of it afterwards, we can use the StatResult class:
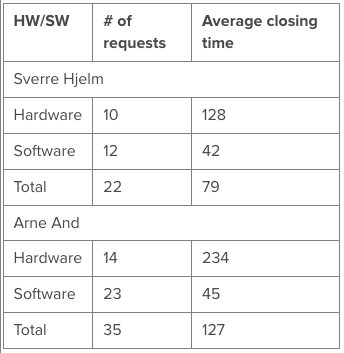 A nice improvement could be to use the
 TimeSpan class to pretty-print the closing time. Also, one could make this into a single-row report (one row per person). Note that in this case, it would be wise to use some variables (or perhaps a map) which remembers each value, and the print the row on result.atGroupEnd(0). The reason for this is that you cannot be guaranteed that all types will show up. If I do not have any requests of type Hardware, then I will never get a group for this. This is similar to grouping in a database.